Carotid artery segmentation in X-ray angiography
A deep learning model that segments the internal carotid artery in X-ray angiography, and a Python application that uses it to make perfusion images of the brain without manual work. Built during my research internship at Erasmus MC; the work contributed to a paper published in 2025.
- When
- Jun 2023 to Sep 2023 (4 months)
- Status
- Offline Research code, not hosted.
- Where
- Research internship at Erasmus MC, Rotterdam
- Built with
- PyTorch, U-Net, Medical imaging, Python, DICOM
- Made as
- Research internship
About the project
Doctors judge blood flow in the brain of stroke patients from X-ray series called digital subtraction angiography (DSA), mostly by eye. Perfusion images put numbers on that blood flow, but making them needs the internal carotid artery marked on every series first, and that was done by hand.
During my research internship at Erasmus MC I trained a U-Net in PyTorch that marks the artery automatically, and built a Python application around it that goes from the DICOM series to four perfusion maps (blood flow, blood volume, mean transit time and Tmax) for many patients in one batch, without manual steps.
Data
- DSA series from the MR CLEAN Registry, a study of stroke treatment in 16 Dutch hospitals between 2014 and 2018: 1024 × 1024 frames from Philips, GE and Siemens systems, at 0.5 to 4 frames per second.
- Artery masks for 150 patients, in front and side views, drawn with a region-growing tool in MeVisLab under a radiologist's supervision.
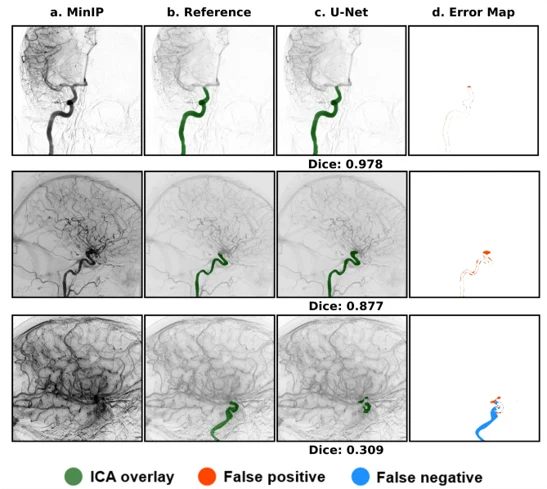
- The model works on one image per series: the minimum-intensity projection (MinIP), where every vessel that filled with contrast is visible at once.
Training
- Patients split 50/30/20 into training, validation and test sets, so that no patient is in two sets.
- A U-Net with five levels down and up, instance normalisation, and a loss that adds cross-entropy and Dice. RMSprop, a learning rate halved when progress stalls, up to 50 epochs on an NVIDIA A40.
- Horizontal flips and small shifts, scales and rotations raised the validation Dice from 0.889 to 0.905. Adding training patients in steps of 10% made no clear difference.
Results
- A mean Dice score of 0.875 on the test set. The weakest cases had strong patient motion, which motion correction before training could fix.
- On 63 test series, perfusion maps from the model's masks were compared with maps from the expert's masks: a paired t-test found no significant difference for any of the four maps (p > 0.05).
- Masks with a Dice above 0.8 changed the perfusion values by less than 10% on average, so a mask does not have to be perfect to be useful.
This was the minor research project of my MSc. The work later contributed to perfDSA, published in the International Journal of Computer Assisted Radiology and Surgery in 2025.
In pictures
How it is built
The application takes a DSA series as it comes from the scanner and needs no manual step. It collapses the series into one minimum-intensity projection (MinIP), where every vessel that filled with contrast at any moment is visible at once, and the U-Net finds the internal carotid artery on that single image.
The mask then goes back to the original frames: the contrast curve inside the artery is the arterial input function, and deconvolving every pixel's curve with it gives four maps of blood flow (CBF), blood volume (CBV), mean transit time (MTT) and time to maximum (Tmax). The second flow shows where the U-Net's weights come from.